Last week I gave a brief overview of the market in it’s current form, Bitcoin dominance was sitting above 68% having seen some seriously bullish price action in the days prior. All that momentum meant we were due a pullback of some short relatively soon, with traders taking massive profits off the tables, coupled with perfect price action around some key levels, the market behaved and is currently moving just how we would like it to, playing directly into the bias.
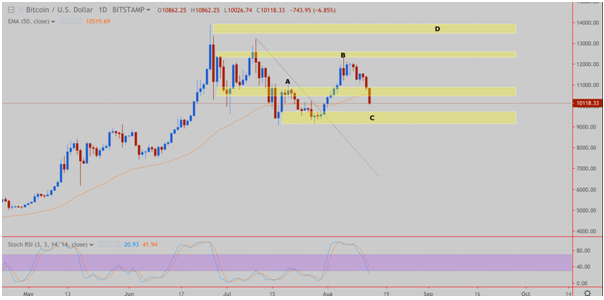
The two charts below show Bitcoin on the daily, the first chart from Wednesday last week, the second from today. Please excuse the slight difference in zonal marking – my charts reset themselves and I made one or two adjustments, the logic remains the same.
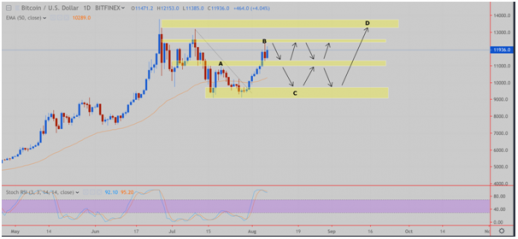
Bitcoin dominance now sits around the 67.5% mark off of it’s two-year highs last week. As you can see, the pullback we were looking for from the higher highs at (B) to zone (C) is now very much in play. Price absolutely shattered the $11 000 – $10 500 zonal support and is currently sitting around the $10 100, looking very much like it will extend it’s downside to the $9500 – $9000 area. I still believe we will see a big flow of retail and institutional money stepping in around this area however, only time and price action will confirm that, for now, we will let this one play out to our analysis.
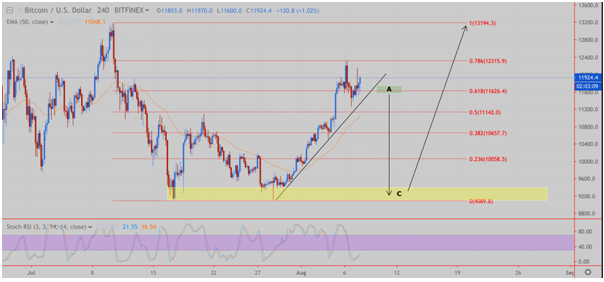
Included in last week’s post was also a 4-hour chart showing a nice clean Fibonacci retracement from previous swing high to swing low, the confluences were lined up ready to rumble and they most definitely did. This time last week saw us watching the back of a textbook rejection off the 78.6% fib retracement on our way to pressuring the ascending trendline which had held since late July. I suggested we watch price action around box (A) for clues on where price would be headed next with our obvious bias to the downside as the confluences kept lining up.
We have now broken our ascending trendline as well as 50% and 38.2% fib retracement levels, with the most recent 4-hour candle wicking off the 23.6% fib giving us our first signs of a slowdown in momentum about a mammoth move to the downside, around 2000 pips.
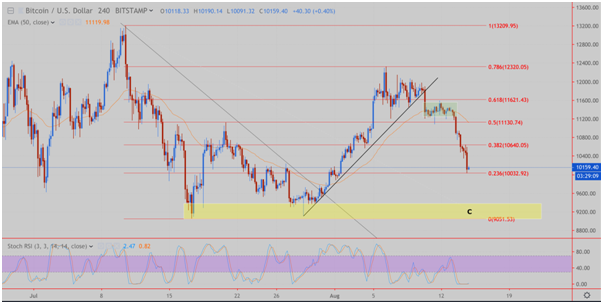
We will need to pay close attention to price action from here to either confirm the final push down to (C) or we may possibly see a reversal from around the current $10 000 zone as this psychological price level by nature would attract a large amount of attention and therefore liquidity as the big money look to potentially step in and begin placing their orders.
I still believe we will see one last push to the downside, and I stick by last week’s analysis, only time will tell, be patient and let the market come to you.
Until next week,
Jarryd