After Bitcoin’s “barn-storming” run from $8000 to almost $14000 in just two weeks we’re now seeing signs that we may be running out of steam.
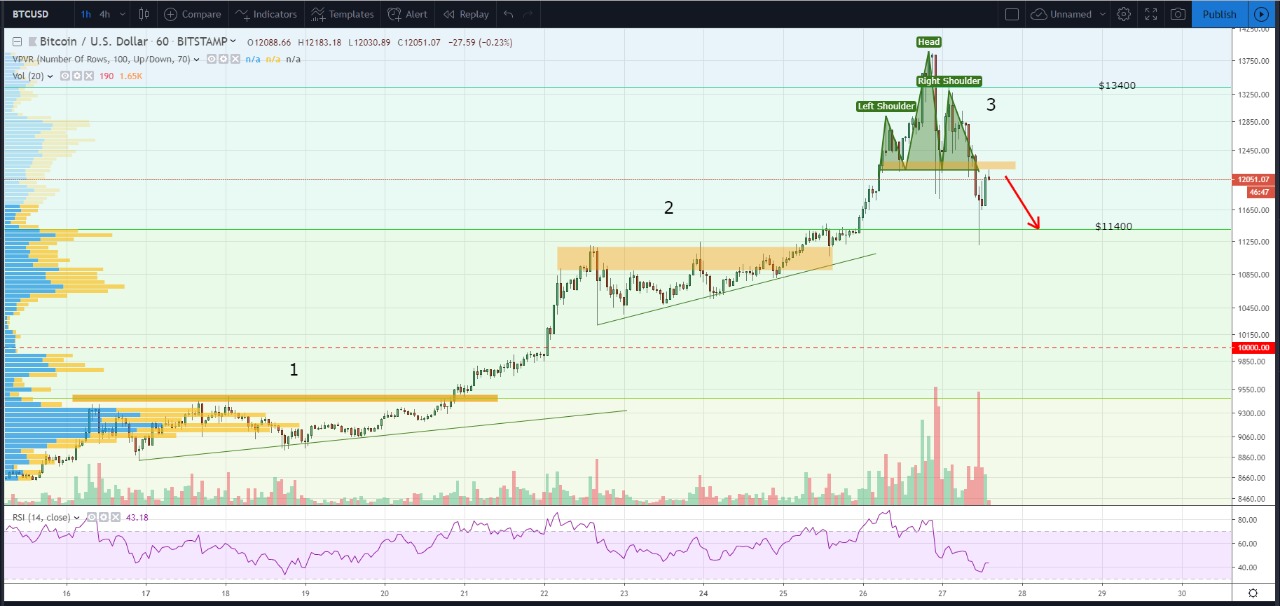
The chart highlights 3 patterns. Number 1 and 2 are both ascending triangles which are continuation patterns i.e. they suggest that the market will continue its upward trend. Number 3, however is a head-and-shoulders which is a reversal pattern i.e. it suggests a change in trend. All these patterns have played out perfectly as per the textbook!
$11400 and $13400 were identified as areas of potential resistance on the way up and proved to be good profit-taking levels. Now that we have broken down out of the head-and-shoulders we have bounced up and are looking to test the neckline which should now act as resistance. As such I expect a move to the downside from current levels back to $11400.
We’ll have to then reassess from there, but for now bear is the most likely short term outcome in my opinion. Having said that we are still in a strong bull market overall, so having taken profit off the table I’m looking for the next bullish setup to enter long!