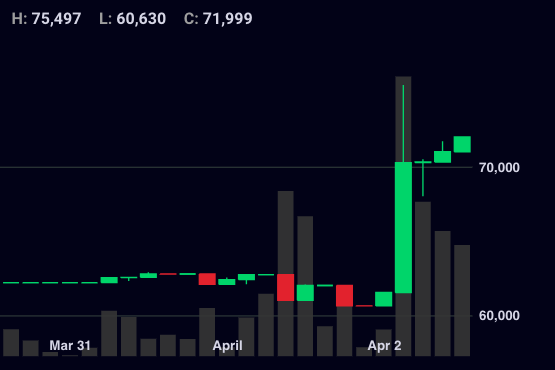
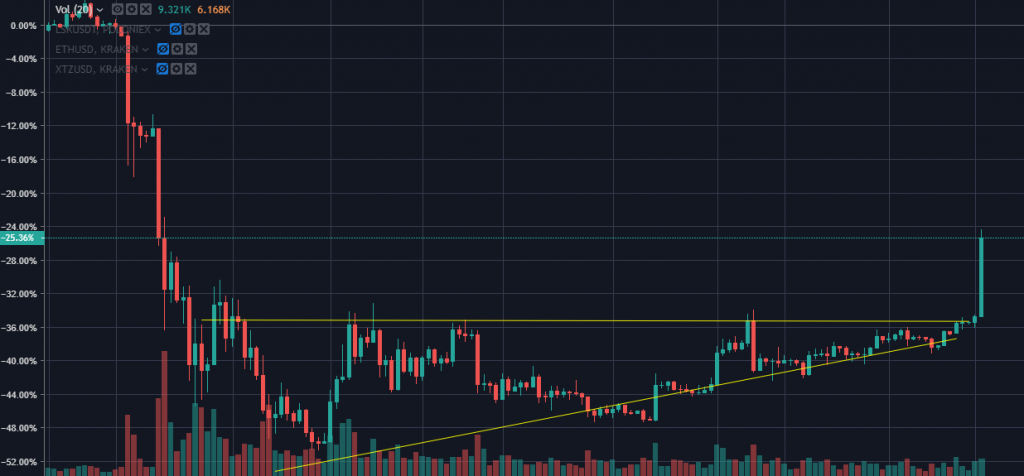
Cryptocurrency enthusiasts the world over woke up to the excitement of seeing one mighty green candle on the Bitcoin price chart this morning. As you can see on the Luno chart below, the price jumped R10,000 (or 20%) in the matter of a single hour.

In last week’s Market Analysis, Graeme Tennant outlined an Ascending Triangle pattern that was forming on the chart, and said there could be some upside on the way. What we didn’t realise, was just how soon that upside would come!
That green candle you see there took place in a single hour. In one hour, the BTC/USD price jumped from $4200 to $5000, depending on which exchange you were looking at. An $800, or 20% move. This is why people love crypto – it’s still so small that just a little bit of buying creates violent moves of this nature. Great for bull markets, brutal in bear markets.
But does a 20% move in an hour indicate the bulls are back?
We chat with our Financial Analyst, Graeme Tennant, to see what he thinks. And I can tell you, it’s good news. If it’s TLDW (Too long didn’t watch), Graeme closed off by saying he is now 70% bullish 30% bearish. That’s the most bullish he has been in a year.
That must be saying something.
Give the video a watch below, or listen to it on your favourite podcasting platform.
Below is the analysis in audio format which you can listen to right here and right now from the comfort of your own web browser:
So it looks like we could be in for an interesting few weeks and months in the crypto markets.
Stay close to Global Crypto, and subscribe to our newsletter, for the latest updates and analysis on where the price could be headed and what to look out for.
Be sure to subscribe to the podcast on your favourite podcasting platform as well:


