We’re back with the Market Analysis series after a “festive period” hiatus. Of course, it would so happen that during that hiatus, the markets went on a significant rampage! What a run it has been, with Bitcoin smashing through it’s all time high (in fact doubling it!) and ETH about to break its ATH as well.
The live-streamed analysis is a full 35 minutes long, and provides some great insights from an experienced technical analyst like Graeme which provide ample educational opportunities, and was sponsored by innovative OTC online trading desk HAYVN Global.
You can watch the full analysis on YouTube below:
If however you want some of the key takeaways from the analysis, here is what we can tell you…
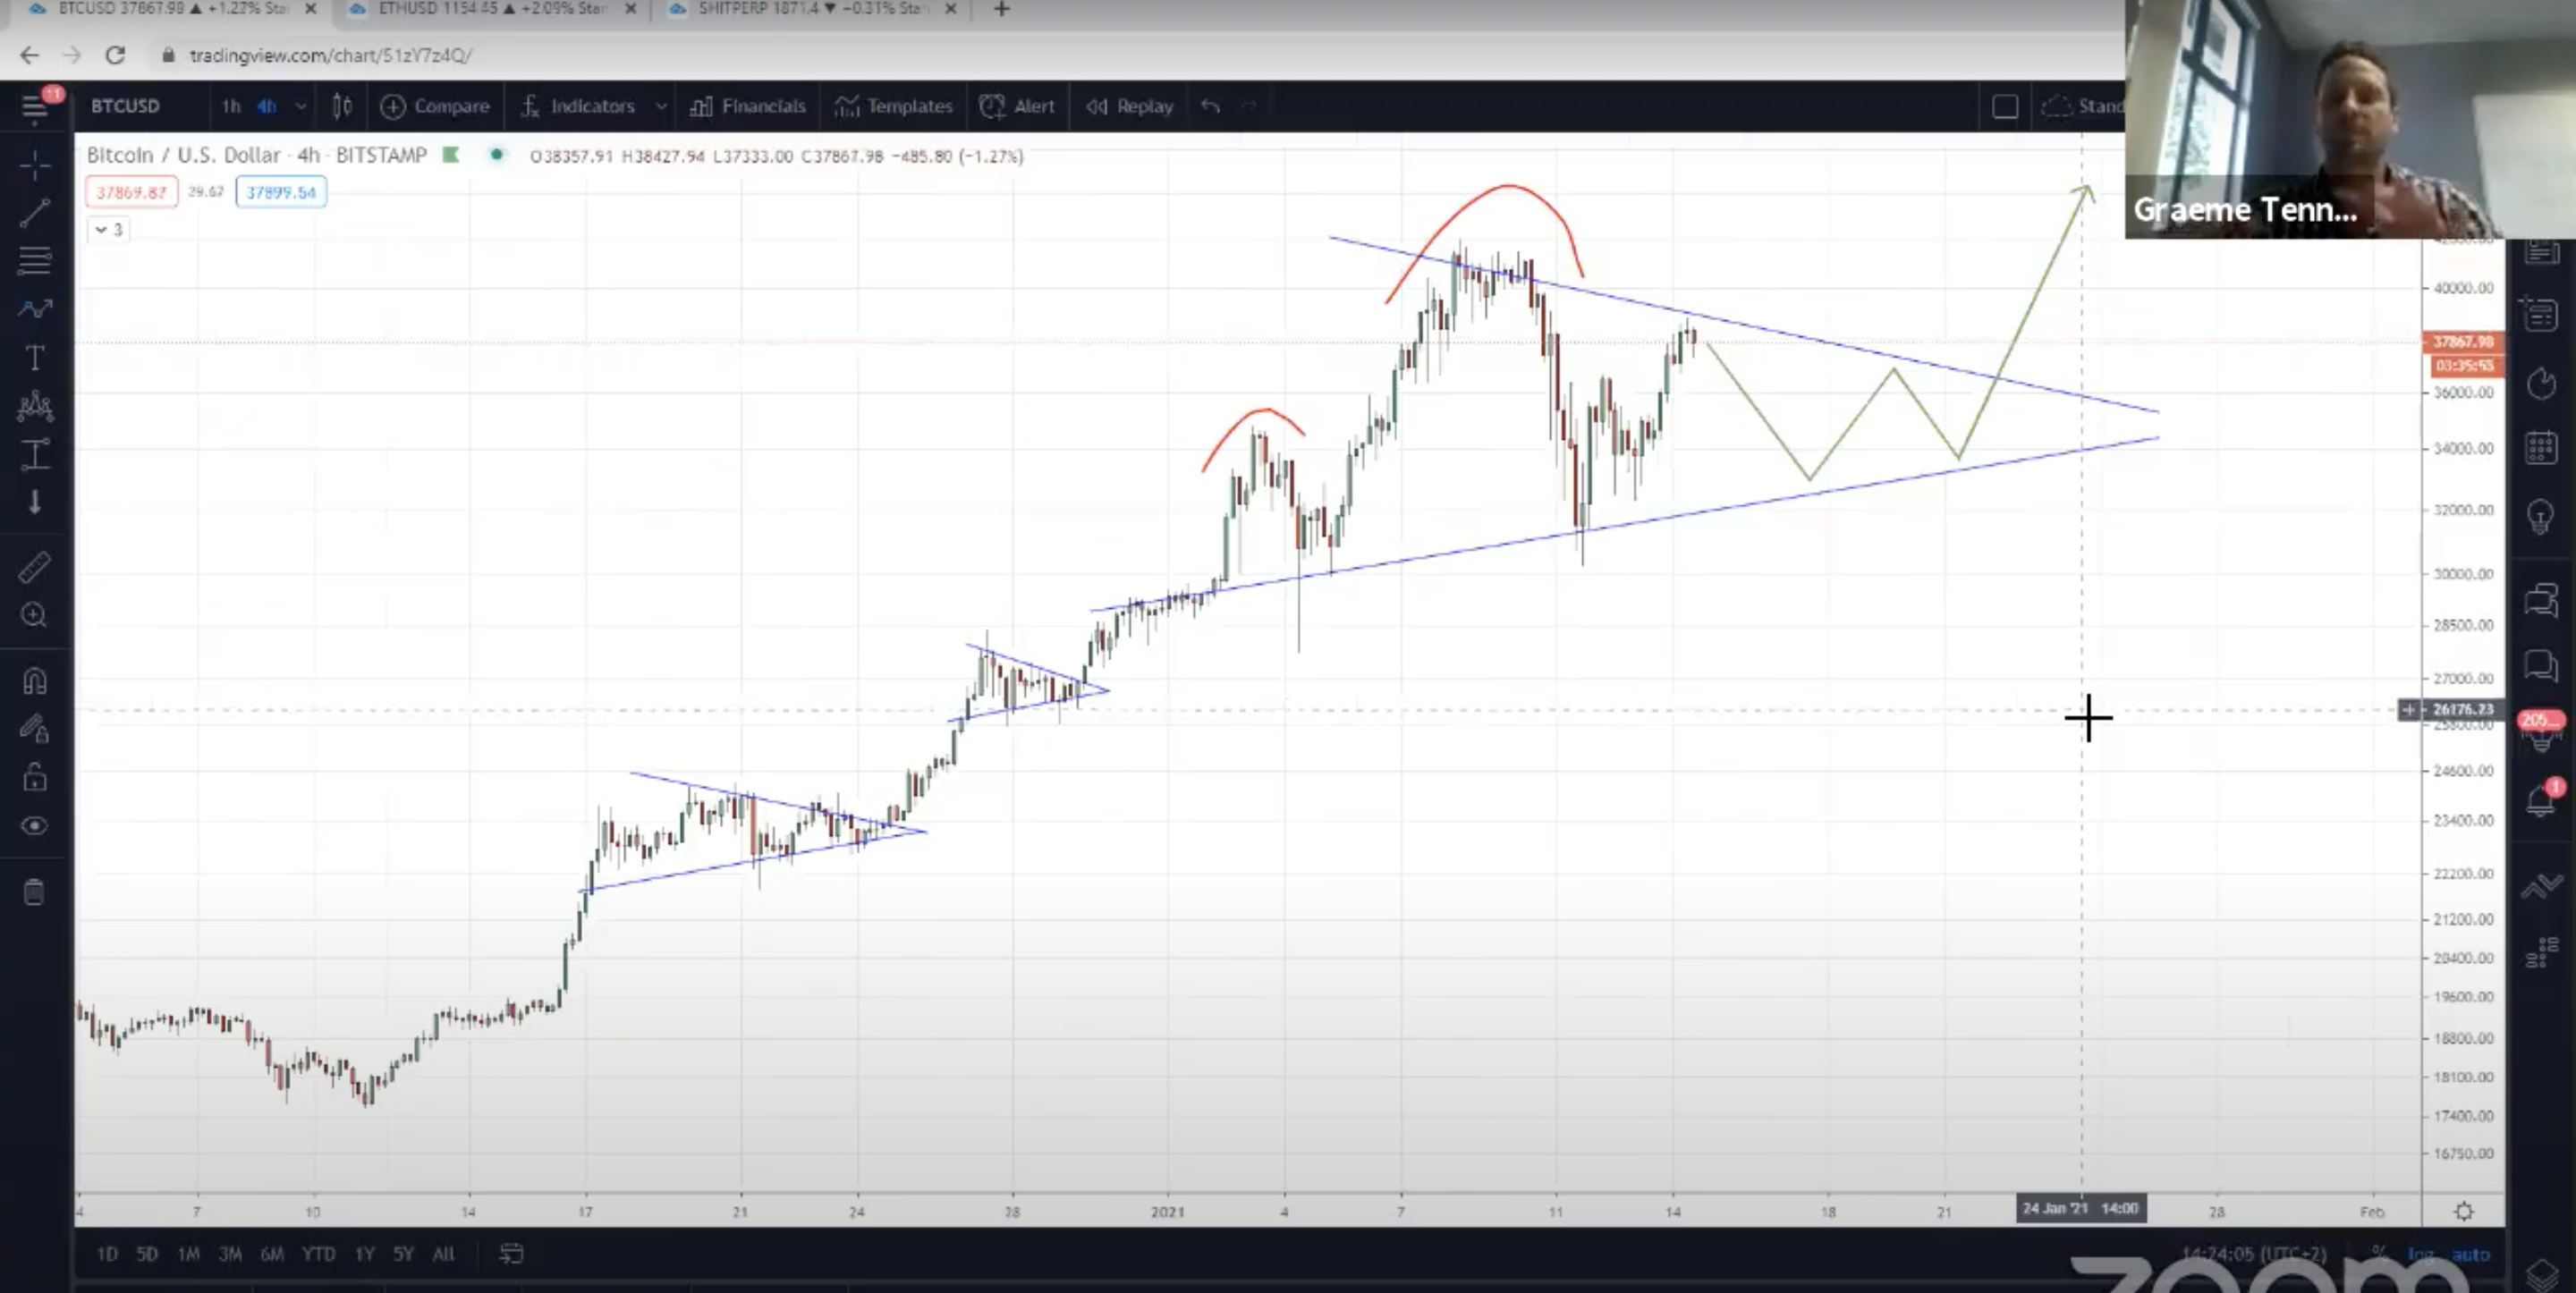
Graeme saw a Head and Shoulders pattern on the Bitcoin chart that seemed to be developing. H&S patterns are bearish, and so seeing it develop would have signalled warnings for Bitcoin bulls.
But Graeme highlights that the right shoulder is becoming too drawn out and long to pose a serious threat, and believes it will soon be invalidated. Instead, he sees another symmetrical triangle starting to develop, with the price possibly bouncing around within those trend lines before another breakout.
Of course, time will tell:

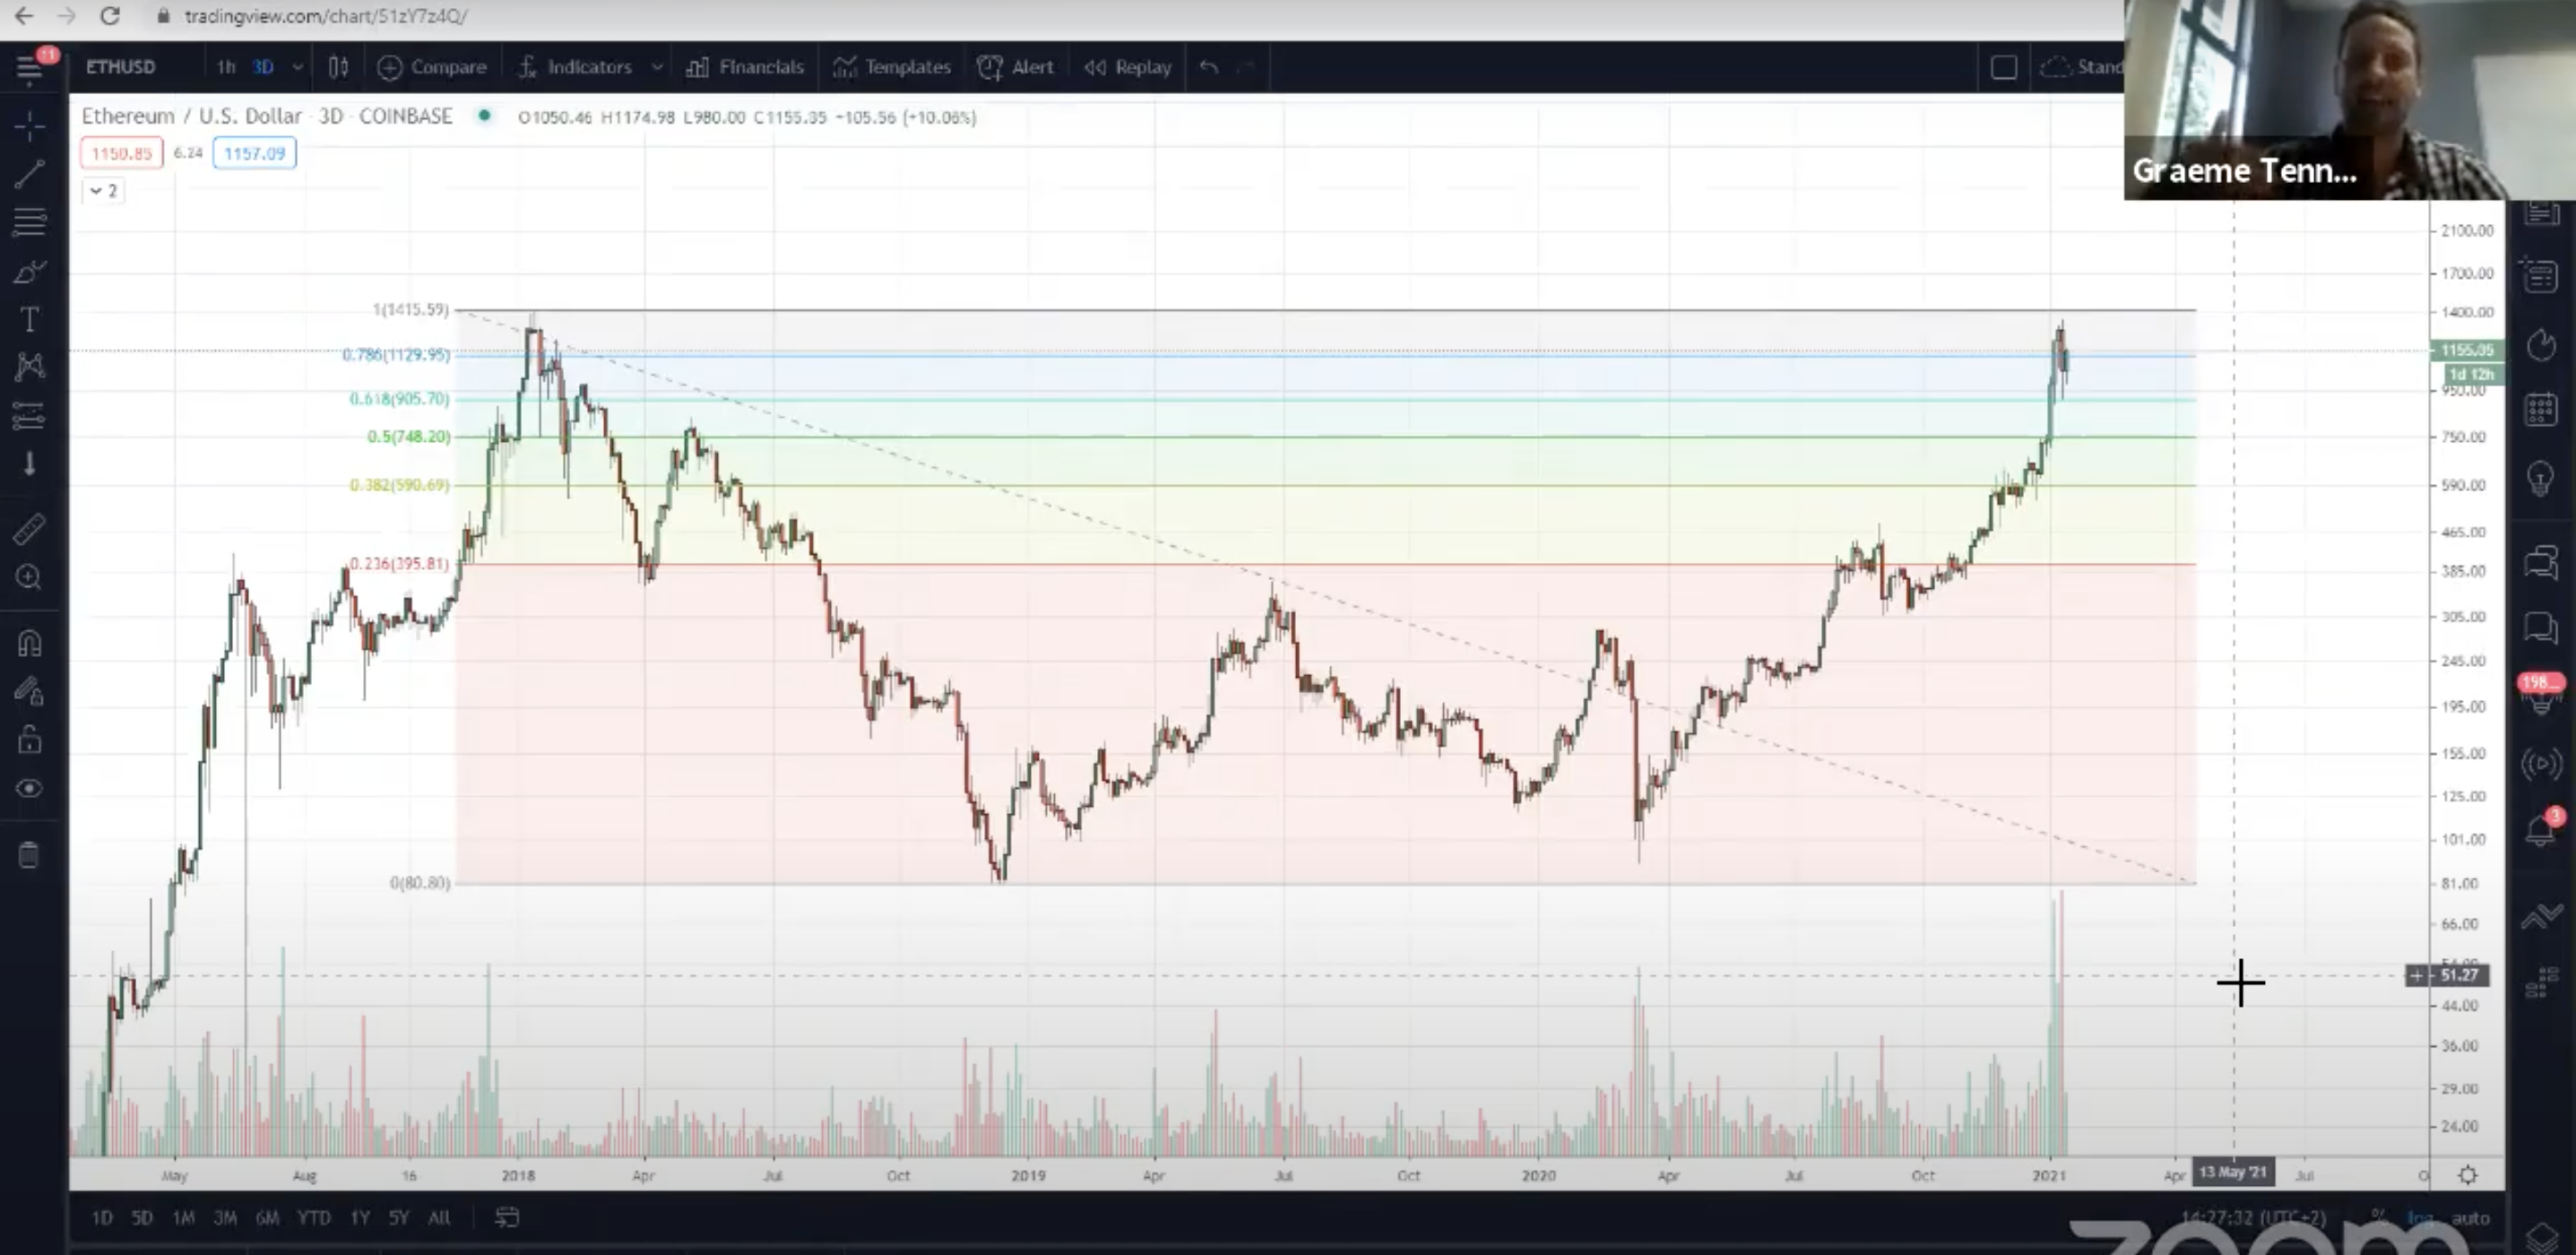
After analysing the Bitcoin chart, we take a look at Ethereum, and take note of the fact that the smart contract platform hasn’t yet broken through its All Time High from Jan 2018, meaning there is a lot of room for growth. Graeme did however raise the point that this Bitcoin run seems to be fuelled by institutional buyers, and such buyers are looking for liquidity, which is far more available in the Bitcoin market than it is in Ethereum. So it will take time for ETH to catch up.

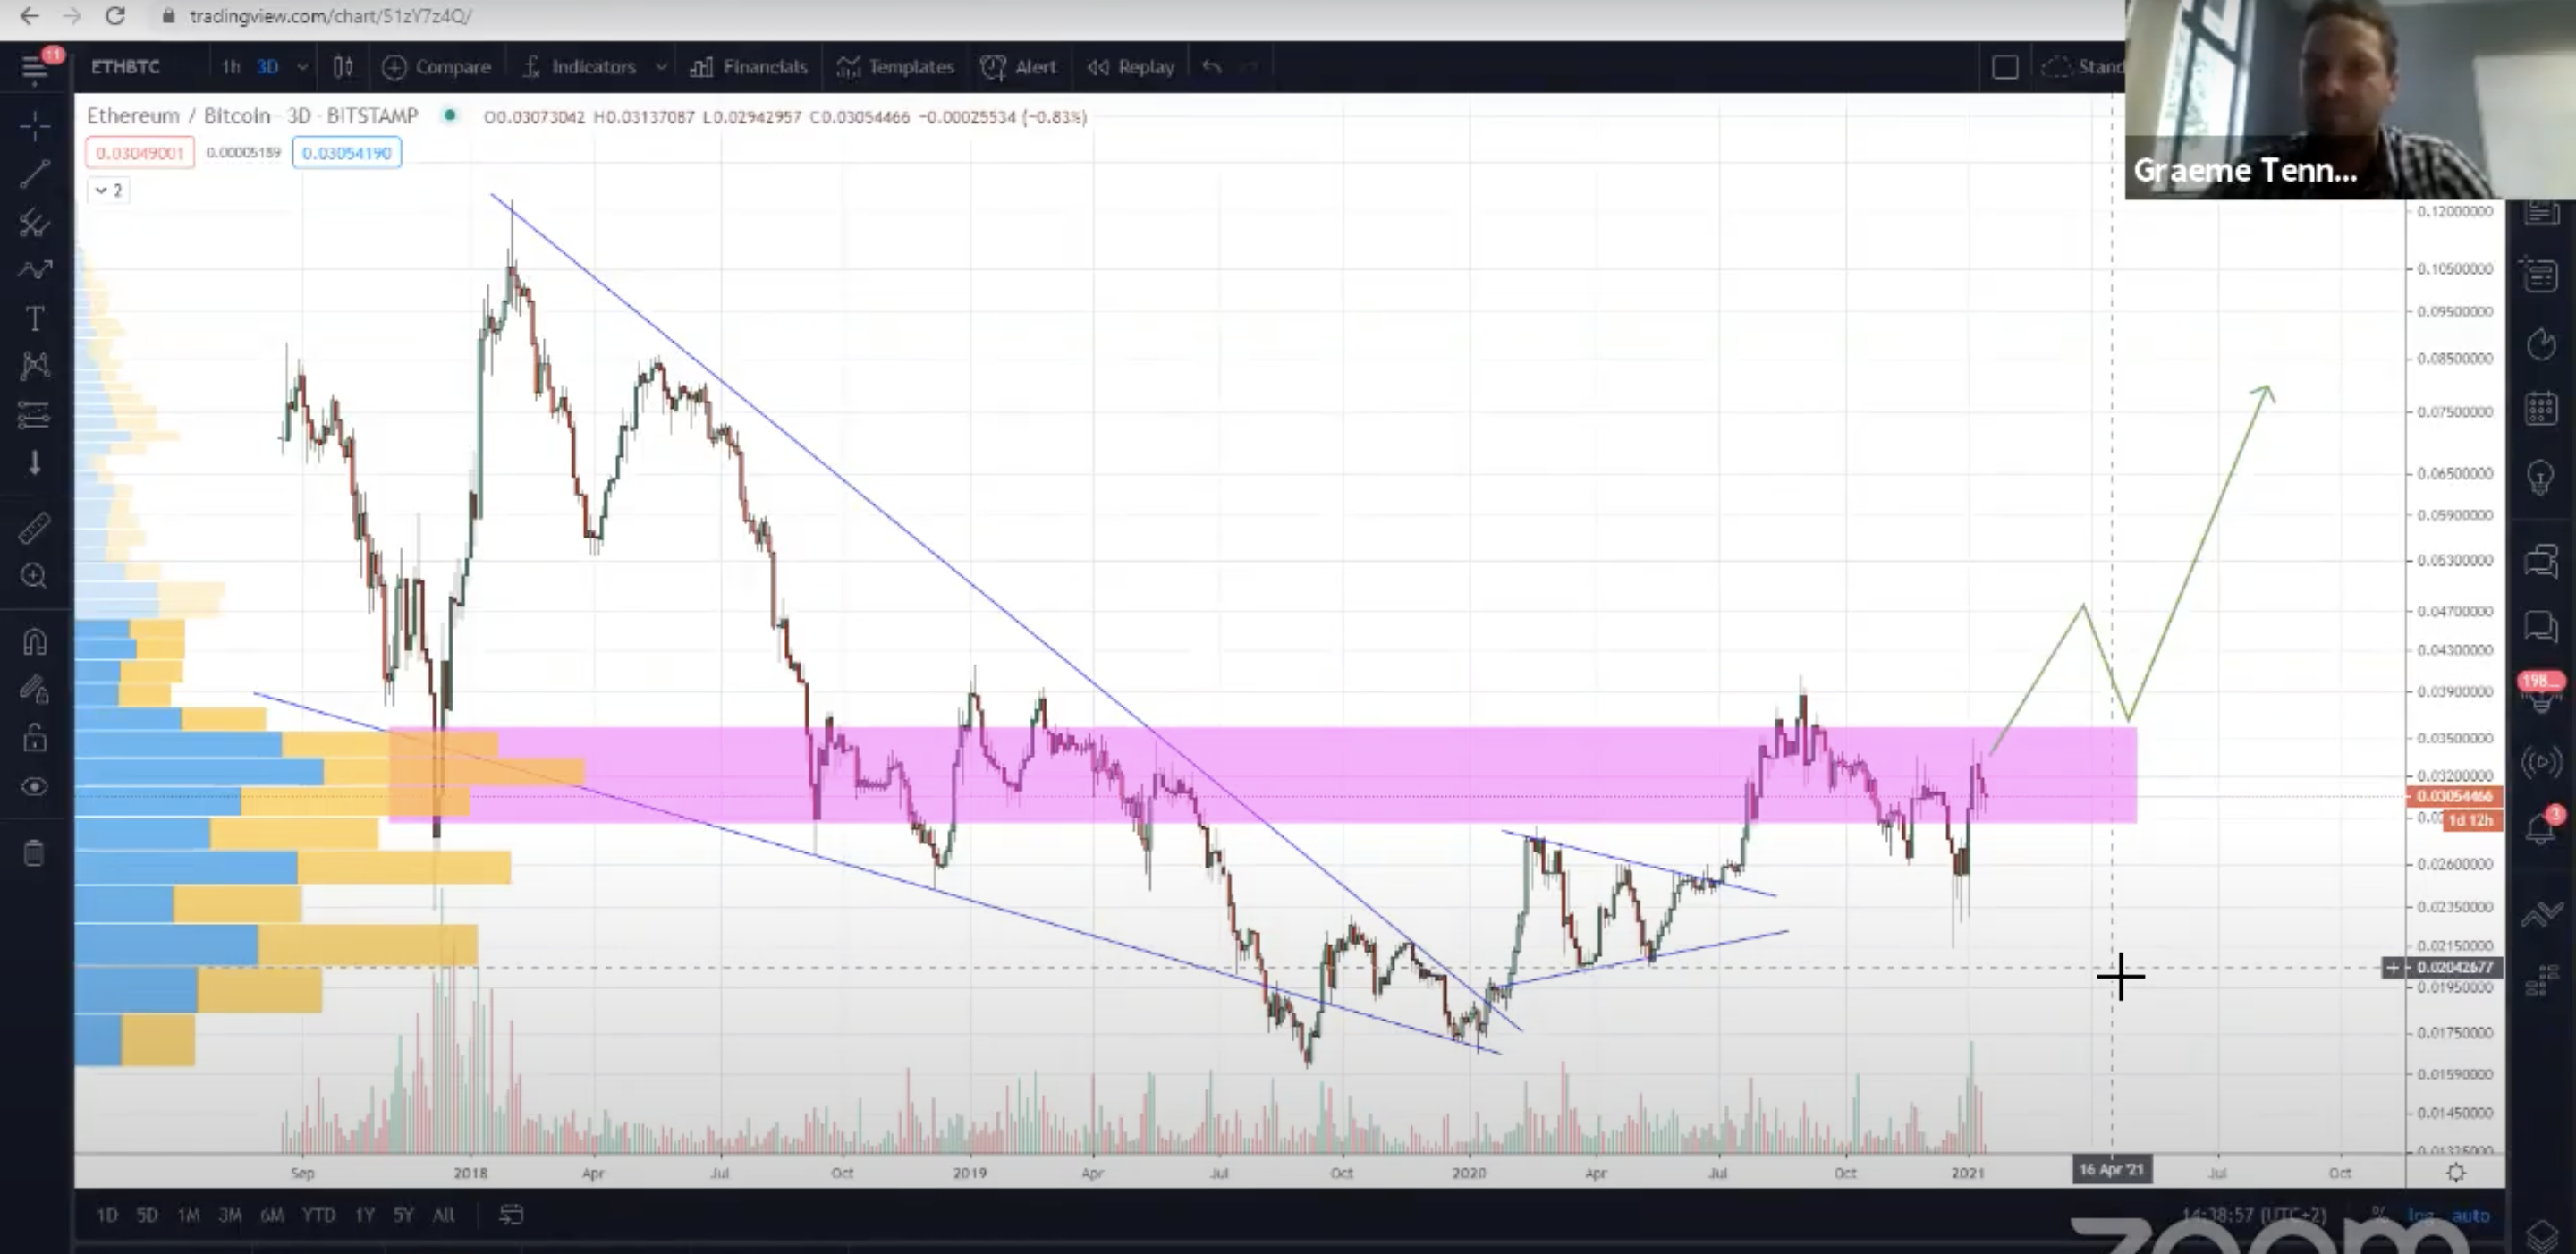
Besides also looking at the Altcoins Index on FTX, which we won’t go into now, we looked at the ETH/BTC pair, which always provides a nice indication of how alt season is coming along.
We noted the strong breakout of the falling wedge pattern, and a new resistance level formed in the pink zone below. Once the ETH price (priced in BTC) breaks out of that pink zone, alt season could well kick off. So it’ll be interesting to see how that develops.

We’ll be back with another analysis next week to see how these charts and patterns are playing out, and what could come next in this most exciting time for crypto enthusiasts.
Until then… HODL.


